
Table of contents :
3: Debugging an example page.
Now that you have a little understanding of some of the parts of the screen, lets start with a very simple example.
                                      body {
                                        background-color: lemonchiffon;
                                      }
                                      .orangelink {
                                        color:crimson;
                                      }
This is the HTML file it belongs to:
              <!DOCTYPE html>
              <html lang="en">
              <head>
                <meta charset="utf-8">
                <meta name="viewport" content="width=device-width, initial-scale=1">
                <meta name="description" content="DevTools Example 01.">
                <title>DevTools Example 01</title>

                <link rel="stylesheet" href="devtools-example-01.css">
              </head>
              <body>
                <!-- Navigation -->
                <ul class="navbar">
                  <li><a href="index.html">Home page.</a></li>
                  <li class="orangelink"><a href="second.html">Second link.</a></li>
                  <li><a href="news.html">Latest news.</a></li>
                  <li><a href="links.html">Some links</a></li>
                </ul>

                <!-- My Page Header -->
                <h1>This is my page header !</h1>

                <p>Welcome on my DevTools testpage!</p>

                <div class="container">
                  <h3>Heading inside a container</h3>
                  <p>p-element inside a container</p>
                </div>
              </body>
              </html>
Opening it in a browser, this is what we get:
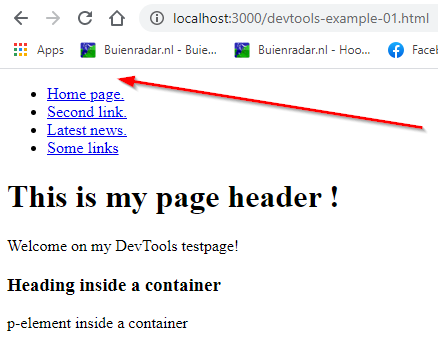
There is no color at all! So it is time to use DevTools. Put your mouse on the page, about where the red arrow ends, and rightclick to get the context menu. Choose "inspect". That gives us:
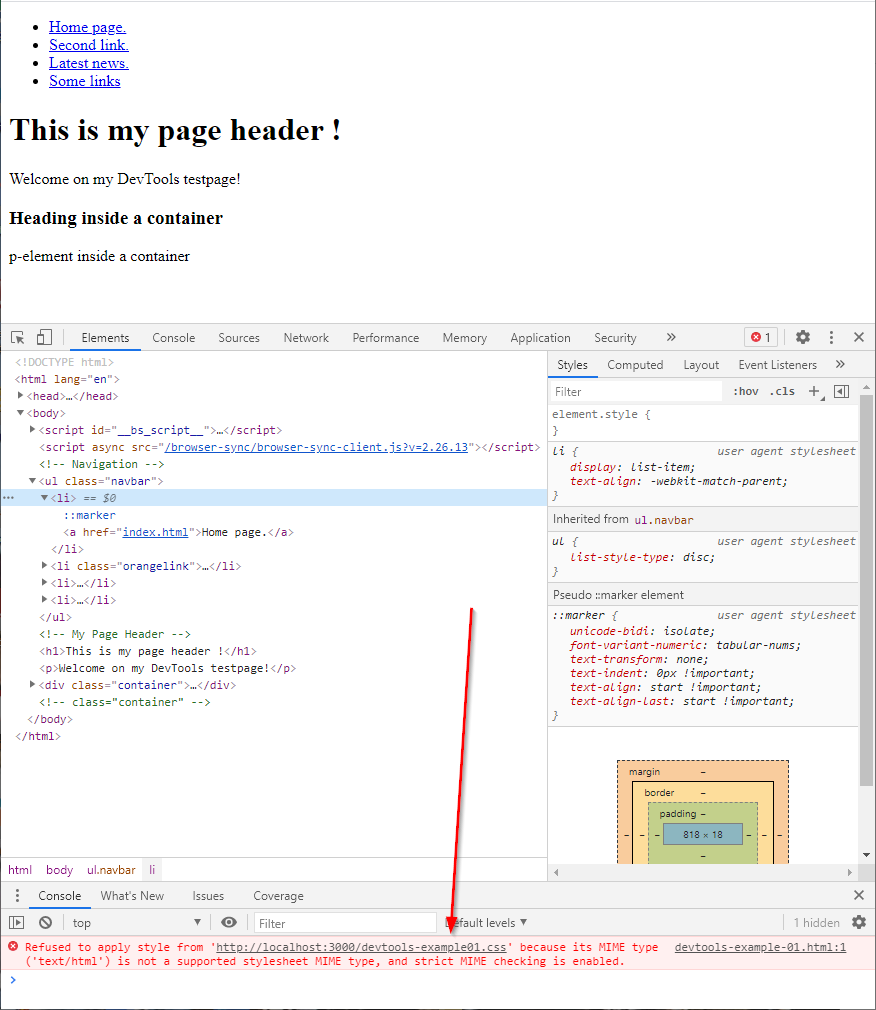
We immediately see there is an error in the console tab, it cannot load a file. (see red arrow) Inspecting further we see it is looking for "devtools-example01" and not for "devtools-example-01" So we made a typing error in the link for the stylesheet in our HTML file. There is a minus-sign (-) missing before "01".
We correct that and reload:
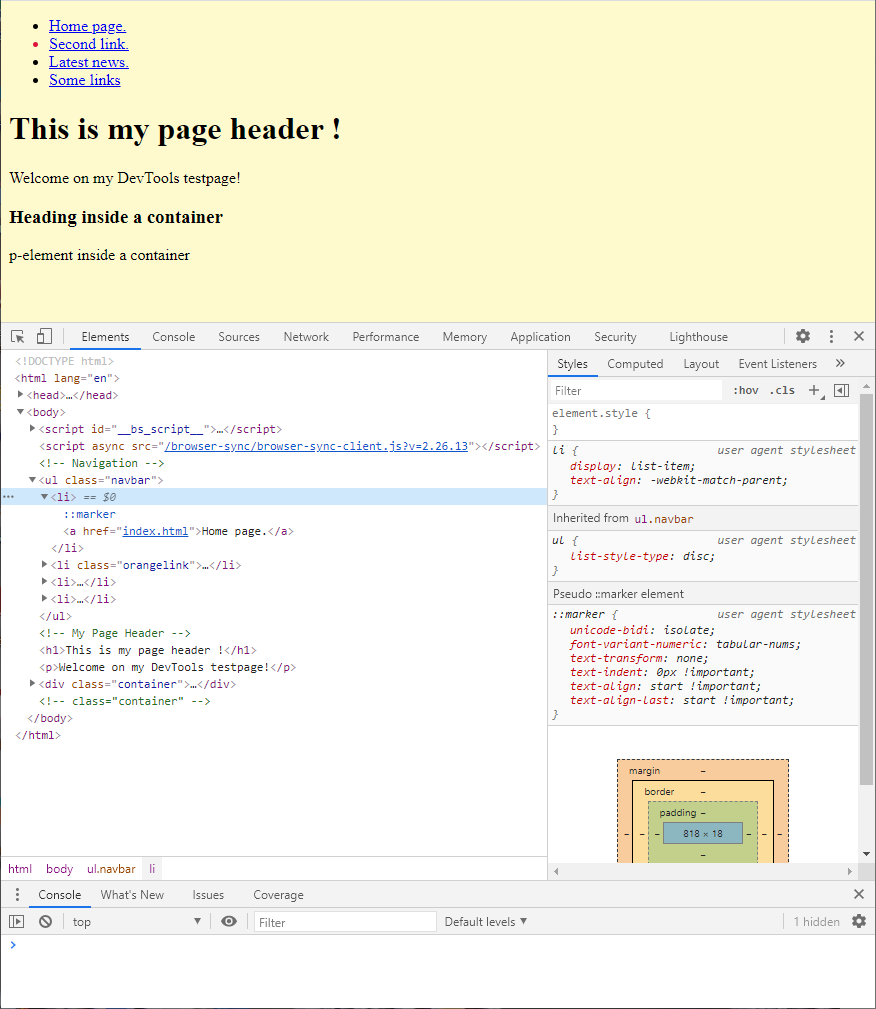
That′s better, we have a yellow background, but the second link is still blue, only the dot in front of it is orange.
TIP:
Hover your mouse in the elements pane of the Developer Tools window, over the li as in the next screenshot. And watch what happens on your actual webpage:
Move your mouse over elements in the elements pane and watch them being highlighted in your webpage.
This is a great help on long webpages. If the element is out of focus, the white label is positioned near the top or bottom of your page to indicate it is further away on that page, so you know which direction you have to scroll your actual webpage to get the correct element in focus to inspect it.
Now we want to know why the link is not orange, so we inspect as follows:
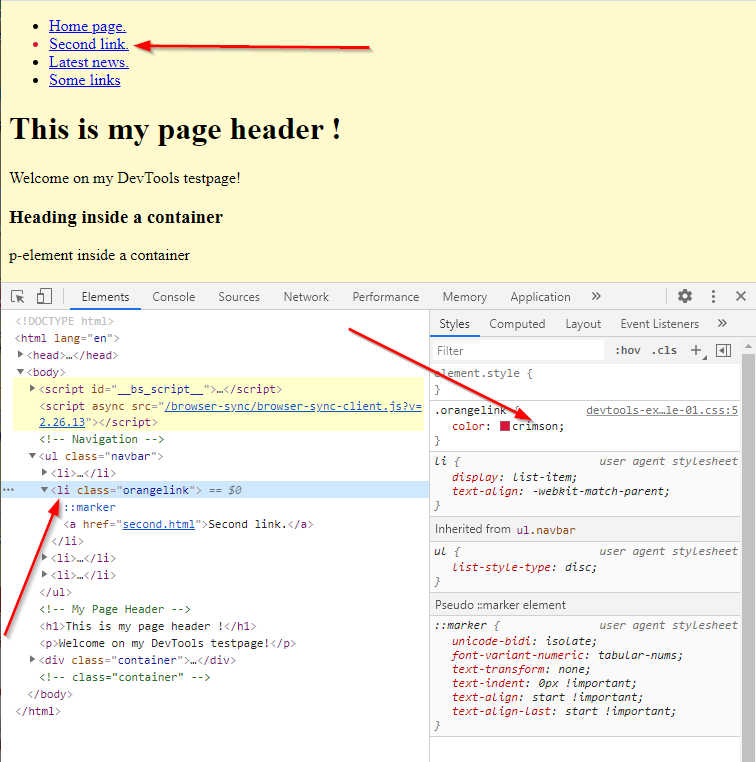
The left red arrow in the screenshot above, points to the li that is selected in the elements pane. In the styles pane we can see the color is ok. When we select the "a-href" in the left pane, which is the link that should be colored we see:
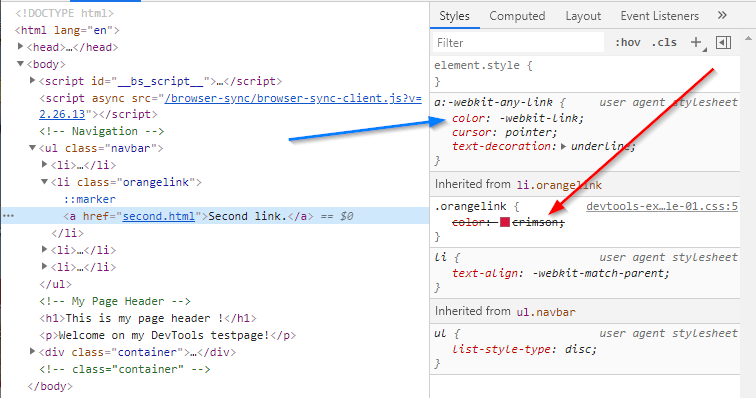
It says: color: -webkit-link; which is blue in this case. So the class "orangelink" should have been given to the a-tag, not to the li-tag.
Now this was very obvious of course, but I only used it as an example of how to debug things.
You might have many stylesheets inside one HTML file, so how do you know which stylesheet a definition comes from?
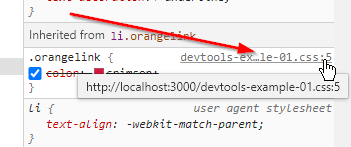
More about using many stylesheets in the article: Stylesheets and Defaults."