
Table of contents :
2: Chrome DevTools: part of its screen explained.
Because I use Chrome as my default browser, I will explain the Developer Tools as they are for Chrome. Now you might use a different browser, in that case you can have a look at "What are browser developer tools?" in the MDN Web Docs. That explains things for many other browsers.For Chrome the tools are called "Chrome DevTools". They are built into the Chrome browser itself. You can use them for local pages but also for webpages on your server. With the Chrome DevTools you can inspect and edit pages on-the-fly. That way you can see what styling is actually used by the browser, which might be something different from what you meant the styling to be.
Very important to know is this: Whatever you do with the Developer Tools on a website that is online, you only change the way your browser displays it to you, you NEVER can change the online code of the webpage itself. So even if you have no experience at all, you can do nothing wrong.
From the Chrome DevTools I will describe the things I know and use. There is more to know, you can also debug javascript for instance, but I will not explain that, because so far I never used it. So I suggest if you want to know more about that, you go to: Debug Javascript with DevTools.
Lets first see how we can show the DevTools.
-
The easiest way is by holding your mouse over an item on your webpage and
right-click your mouse. This item can be some text, a header, or
anything you want. Put your mouse close to where things are wrong,
that gives the fastest results.
After the rightclick, a context menu pops up, choose "inspect", which is the very last menu item of the context menu. - The other way is from the vertical "..." menu near the top right corner of your chrome window. Choose "More Tools..." then choose "Developer Tools".
TIP:
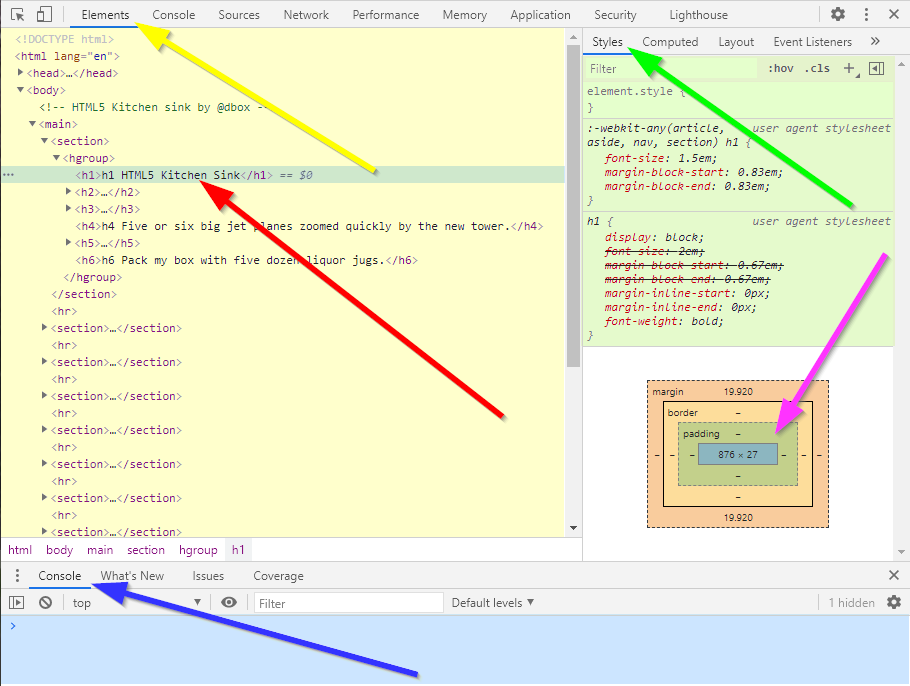
You can click on the pictures in this article, to have them open up in a separate window. That way you can have this window and the picture side by side to follow the explanation.A quick explanation of the different parts of this screen:
-
In Yellow: This is the Dom tree, here you see the source
of your webpage. The yellow arrow points to the "Elements"-tab,
on which your code resides.
With the tiny little arrows in front of eacht line of code, you can open and close the corresponding tag, and the codelines inside it. Hidden code lines are represented by "..." in between the tags.
The red arrow points to the selected line, a h1 tag in this case. -
In Green: This is the "Styles"-tab. It gives the
styles of the selected line on the elements-tab. You can see in
this example there are two sets of styles for this h1 tag, they are
separated by a horizontal line.
The top-most style set is the most important one.
You can read more about the stylesheet sequence in the subchapter about "CSS Cascade" in my article about User Agent stylesheets and Defaults.
You might have noticed (in the green accentuated part), some styles have strike-throughs, for instance: font-size. First it was 2em (in the lowest, less important stylesheet), but because of the top-most, more important stylesheet, it now is 1.5em. And the 2em in the lower stylesheet, gets a strike-through.
The definitions in the top-most style sheet are of more importance then the ones below. You can see the same happens with the margins. The values that are finally used, come from the topmost stylesheet. -
With Pink arrow: This is a very important square. It is the
Box-model of the selected HTML element in the elements pane.
It always gives
the size of the element, the way the browser sees it.
This selected h1-element, has a size of 876 (w) x 27 (h) pixels (the h1-element itself, is the blue-ish area in the middle).
The padding on all sides is none, denoted by the "-" signs (in the greenish area).
The h1-tag has no border (also "-" signs in a yellowish area), and top- and bottom-margin are a funny value of 19.920(pixels) Margins are colored orange.
The funny value of the margins, is because of the 0.83em margin-block-start-value recalculated to pixels.
When you hover over a tag in the elements pane, and look in the browser part of your window above, you will see the same colors for element, padding, border and margin as used in this square.
Except when something is "zero", so suppose there is no padding, you will not see a green color in the browser window near the element. If an element has a padding AND a margin, you will see orange and green around it.
Experiment a bit with this hovering and coloring, and you will get a feeling for how it might help you.
Suppose 2 elements on a page are above eachother, but too far apart vertically, then hovering over them and looking at the colors will help you see, if that is caused by the padding or margin of the top or bottom element, or a combination of that.
Inside this box-model you can directly edit the margin, padding and border.Box-model Box-model, you can edit by clicking as shown.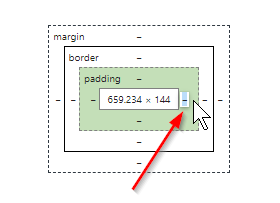
-
In Blue: with the blue arrow, is the console.
It shows any errors that might occur when loading or processing the page. For instance, stylesheets or pictures that the browser cannot find. If this console is not empty, try to solve that first.
Hint: you can keep your mouse above the url of a missing file and it will show you the full path the browser is looking at.
- Console tab This tab is for debugging Javascript.
- Sources tab This tab can show the files that belong to this website. You can also view them there.
- Network tab This tab shows the files that were loaded for this page.
"Chrome DevTools, Chrome Developers."
or at: "Browser Developer Tools Tutorial."