
Table of contents :
Debugging,
what tools to use and how to use them.
These pages describe the Chrome Developer tools (Chrome DevTools) and
how to use them to debug your webpage. It is an introduction, and does
not describe each and everything. But after reading you will be able
to understand the basics.
1: Introduction and quick debugging tips.
This article assumes you know how to write HTML and how to style it with CSS.If you don′t know how to do that, you could go to the Getting started with the web page of the MDN Web Docs. That gives an excellent explanation, starting from a complete beginner.
But even when you are more experienced, after writing it, your page does not always look as expected. So if that happens how do you find out what went wrong?
HTML consists of elements, each with an opening and closing tag, so the first thing to check is for missing end-tags. After all, while editing a page you might have accidentally deleted some, or added too many.
Personally I use Visual Studio Code to edit my webpages. It is freeware, open source, and has nice syntax coloring which helps a lot in finding your mistakes. It also has many plugins: a plugin to compile Sass, a Live server plugin, plugins to color your code, and many more. Have a look on Youtube for Visual Studio tutorials.
TIP:
What I think is very important in using Visual Studio Code, is that you can easily format your code. And well formatted code is way easier to debug.I always use 2 spaces to indent a level and I let Visual Studio reformat pieces of code regularly to keep things tidy. Visual Studio highlights the matching tag for you when you set your mouse on a tag. That also helps in finding problems in your code.
TIP:
It is also good practice to add a comment to important closing tags, telling what starting tag they belong to. The matching tags might end up very far apart sometimes, separated by many lines of code. So add the comment right away, before you start adding any codelines in between the tags. (Visual Studio Code has a plugin just for that!)TIP:
Furthermore with Visual Studio, you can show or hide the content code lines of an element with the little down arrow in the left margin.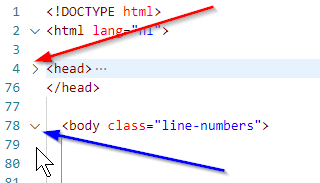
The red arrow points to a closed tag (all lines belonging to the "head" tag are hidden. Lines 4-76 as you can see), the blue arrow points to an opened tag.
This makes your code very readable. For instance you can hide all code lines inside an article. The only thing you will then see are the opening and closing article tags themselves. If you gave the closing tag a comment, it is immediately clear if that is the correct tag.
TIP:
When you put your mouse on a tag and press [F7] Visual Studio will jump to the corresponding tag. If it jumps to something weird, or does not jump at all, there is obviously something wrong with that closing tag.TIP:
Last tip: if you want to be sure your HTML has no syntax errors, you can have it validated through the Markup Validation Service created by the W3C. There you can validate an uploaded file, or an existing webpage or directly input some HTML.When you are sure your syntax is ok, the next step is to check the styling of your page while it is being displayed. What you would like to know is whether the styles you had in mind, are actually being applied for the elements you wanted them to be applied to.
For that you need a tool that inspects and shows you, what actually happens to your page when displayed by the browser. That′s explained in the next paragraph about Chrome DevTools.